Day 4 of V3 Genesis
The Temptation
Six pages needed building. Dashboard overview, Agents & Tools, Data & Stores, System, Reporting, Users & Chats. The enterprise developer in me whispered: real data, real APIs, database queries, proper abstractions…
I told him to shut up.
The Strategic Pretense
func MockStats() Stats {
return Stats{
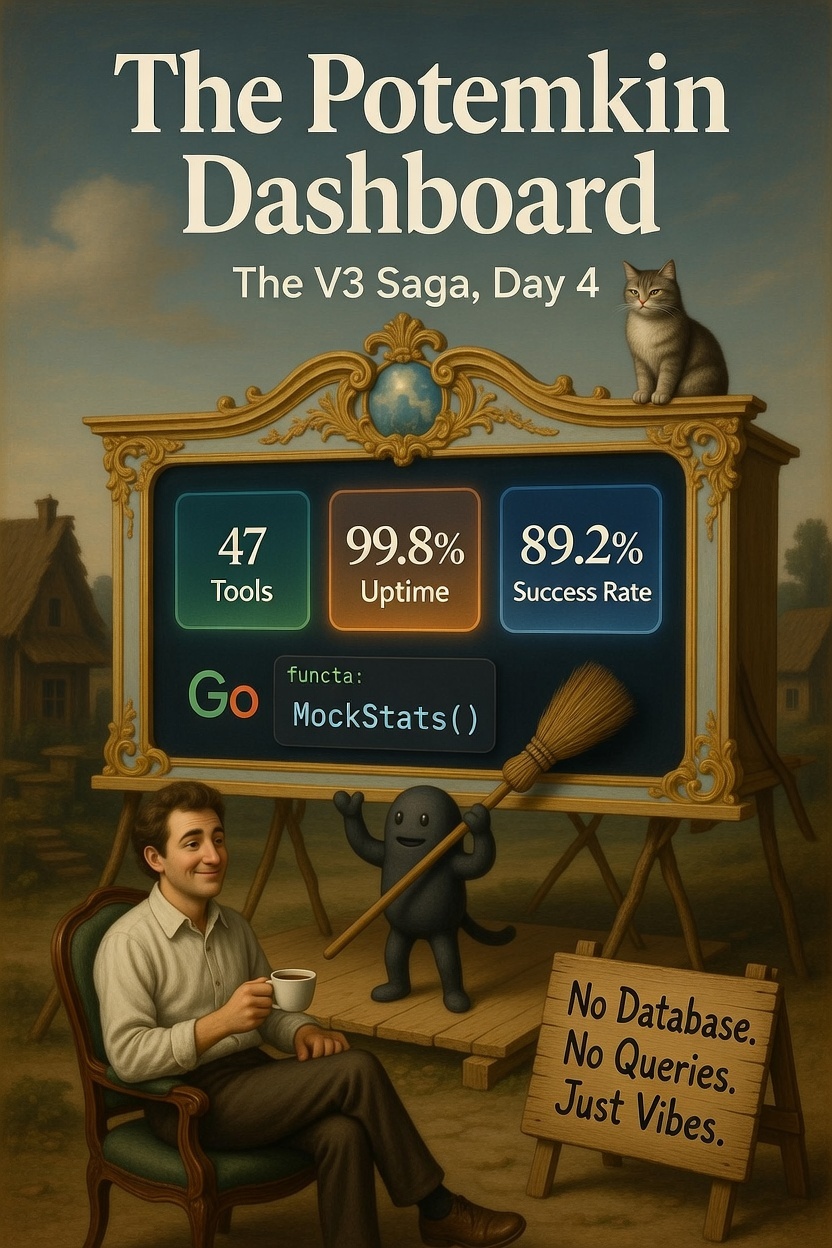
ToolCount: 47, // Trust me
ActiveTools: 12, // Very active
Uptime: "99.8%", // Basically never down
SuccessRate: "89.2%", // The queries love us
}
}
No database. No queries. Just vibes.
The dashboard renders five cards with impressive numbers. A changelog shows fake admin actions: “ricardo updated SQL Generator”, “system performed health check”. It’s a beautiful facade. A village built for the empress’s tour.
The Server Knows Best
The Datastar revelation: the server is the source of truth.
Click a nav icon → @get('/dashboard/agents') → server responds with data-signals:active-page="'agents'". The server doesn’t ask the client what state it’s in. The server tells the client what state to be in.
No client-side state management gymnastics. No Redux. No context providers. Just HTTP and humility.
The CSS Wars
Then came the pixel-pushing:
"The sidebar nav is too short"
→ increase padding
"Now it's too tall"
→ shrink icons from 40px to 36px
"The mini-stats won't expand"
→ stats.css was overriding dashboard.css grid with flex
→ delete stats.css entirely
"Should we split it later?"
→ YAGNI. One file.
144 lines of stats.css — deleted, merged, forgotten.
The Parallel
Somewhere, a login page showed “I can’t do much though…?” to users who’d found a door that Google swore was locked.
Here, a dashboard shows “47 tools” to admins who haven’t configured any.
Both are true in a certain light. The door existed. The tools will exist. The phantom users and the phantom metrics serve the same purpose: proof that the structure works.
The Scorecard
| Deleted | Created |
|---|---|
| stats.css (144 lines) | 6 dashboard pages |
| Hardcoded sidebar nav (44 lines) | MockStats() |
| Client-side state | Server-sent signals |
| Premature complexity | Strategic pretense |
The UI is complete. Click through all six pages. Watch the highlighting follow. Admire the numbers.
When we eventually wire up real data, the skeleton will be waiting. Patient. Hollow. Ready.
The reptile brain built itself a dashboard. Now it has something to admire itself in.
Next episode: The numbers become real. Or do they?
See also:
The Saga (in which facades become foundations):
- The Phantom Users - The parallel discovery of strategic pretense
- The Reptile Brain Awakens - Where the reptile brain dreamed the complexity away
- The Lizard Brain vs The Caffeinated Squirrel - YAGNI in action
The References (Potemkin engineering):
- Potemkin Village - The historical pretense we’re honoring
- [Datastar Signals](https://data-star.dev/reference/signals) - Server tells client what state to be in
- YAGNI - 144 lines deleted, zero regrets