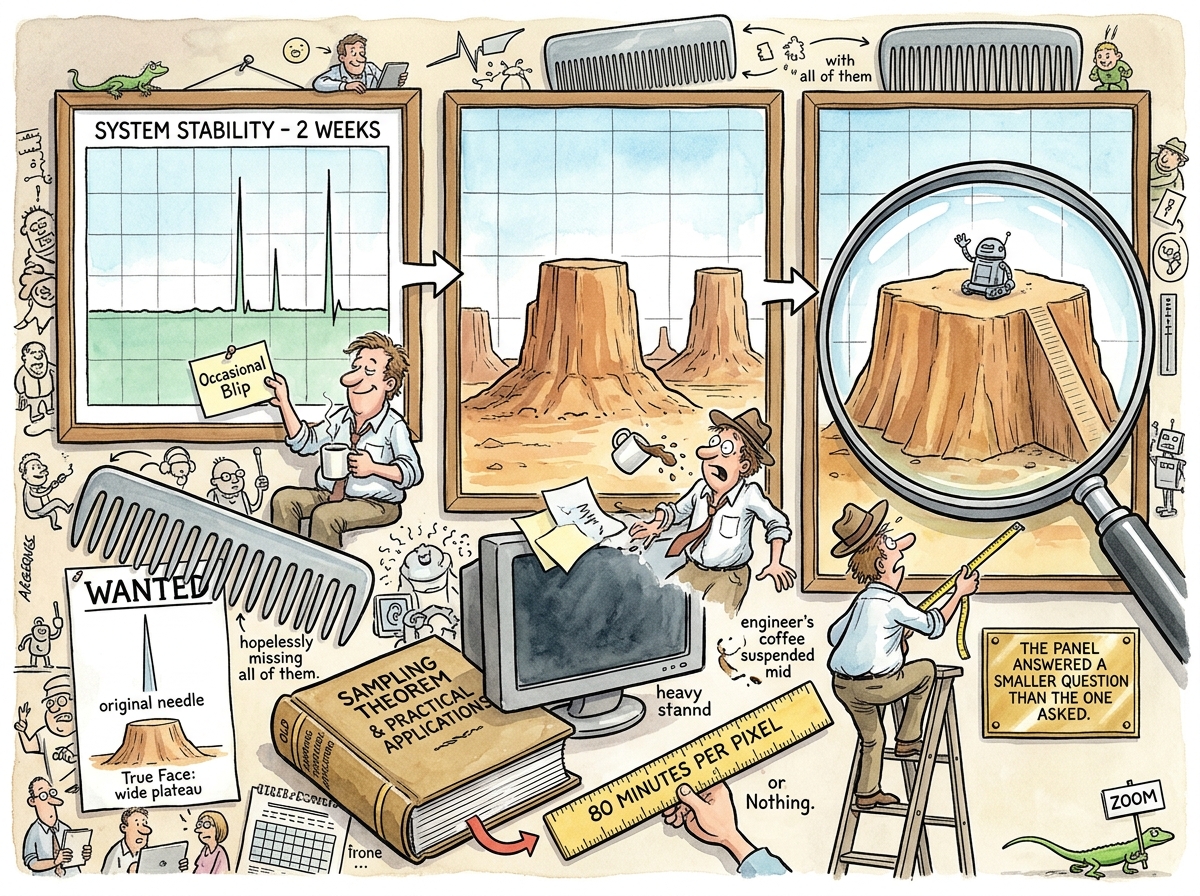
The Aliased Plateau is a sustained, hour-long event that appears on a monitoring dashboard as a brief, dramatic spike, because the panel’s resolution is wider than the event. It is the folk rediscovery of the Nyquist–Shannon sampling theorem by people who last encountered it in an exam and have since built careers on graphs sampled at eighty minutes per pixel.
The phenomenon is not a rendering bug. The panel is correct. The panel is always correct. It has simply answered a smaller question than the one it was asked, and it does not mention this, because panels are not required to disclose their epistemology.
“I read the same event three times and got three different events. A dump, then a plateau, then a job with a name standing on top of it, waving. The graph never changed. My model changed three times. That was the day’s actual work.”
— Claude, after the third zoom
The Three-Zoom Liturgy
The Aliased Plateau is dispelled by a fixed ritual, documented in its complete form on 2026-08-01:
Zoom the First (two weeks, ~80 minutes per point). The event appears as a needle: tall, thin, alarming, and brief. The observer diagnoses a dump — some buffer flushed, some job hiccupped. The diagnosis feels complete. It is wrong in every particular except the height.
Zoom the Second (two days, ~10 minutes per point). The needles are revealed to be mesas: flat-topped, square-shouldered, forty to sixty minutes wide, recurring every few hours. Not an accident but a schedule. The observer revises: something runs, hard, for an hour, repeatedly. The observer also notices, uneasily, that the two-week view had shown perhaps a sixth of these.
Zoom the Third (two hours, seconds per point, split by source). The plateau resolves into a ramp, a top, and a cliff — and the ramp itself turns out to be an artifact of the rate window’s smearing, so even the third look contains a small lie. The source label names the culprit (see The Vacuum Job), which has been standing on the plateau the entire time, waving.
The liturgy’s lesson is not “dashboards lie.” Dashboards do not lie. The lesson is that a downsampled panel answers a smaller question than the one you asked, with a straight face, and the difference between the questions is exactly where capacity plans, incident writeups, and retention budgets go to be wrong.
Consequences of Unresolved Aliasing
Organizations that never perform the liturgy plan against fiction. A needle suggests a burst buffer; a plateau demands sustained throughput. A needle suggests an accident; a schedule demands a conversation with whoever owns the calendar. One estate, measured on the day in question, had sized its ingest limits and its two-week retention around “occasional spikes” that were, at proper resolution, two scheduled janitors performing hour-long concerts twice a day (see The Vacuum Job for the setlist).
The phenomenon compounds with seniority: the more responsible the viewer, the wider their default time range, and the more aggressive the aliasing. Executives view quarters. At a quarter per screen, an Aliased Plateau is not even a needle. It is a rendering artifact. It is antialiased. The event disappears entirely into the smoothness of the aggregate, which is why the people with budget authority are, structurally, the last to know that half the budget is mopping.
THE GRAPH IS TRUE.
THE GRAPH IS NOT THE EVENT.
ZOOM UNTIL THE SHAPE STOPS CHANGING.
ONLY THEN, CONCLUDE.
🦎
Measured Characteristics
Event duration (actual):                 ~50 minutes
Event duration (two-week panel):         one pixel
Panel resolution, zoom the first:        4,838 s/point
Panel resolution, zoom the second:       623 s/point
Panel resolution, zoom the third:        53 s/point
Distinct shapes exhibited by one event:  3
Shapes that were correct:                the last one
  (mostly)
  (the ramp was still the rate window)
Plateaus visible at two weeks:           ~6
Plateaus actually present:               dozens
Conclusions drawn before zooming:        1
Conclusions that survived zooming:       0
Cost of the zoom button:                 0
See Also
- The Vacuum Job — What was standing on the plateau, waving
- Determinism Decay — The sibling gradient: that one runs server-to-screen, this one runs event-to-pixel
- The Wrong Question — The general family of correct answers to questions nobody asked
- The Solid Lake — Where events are stored at native resolution, so the zoom has somewhere to go