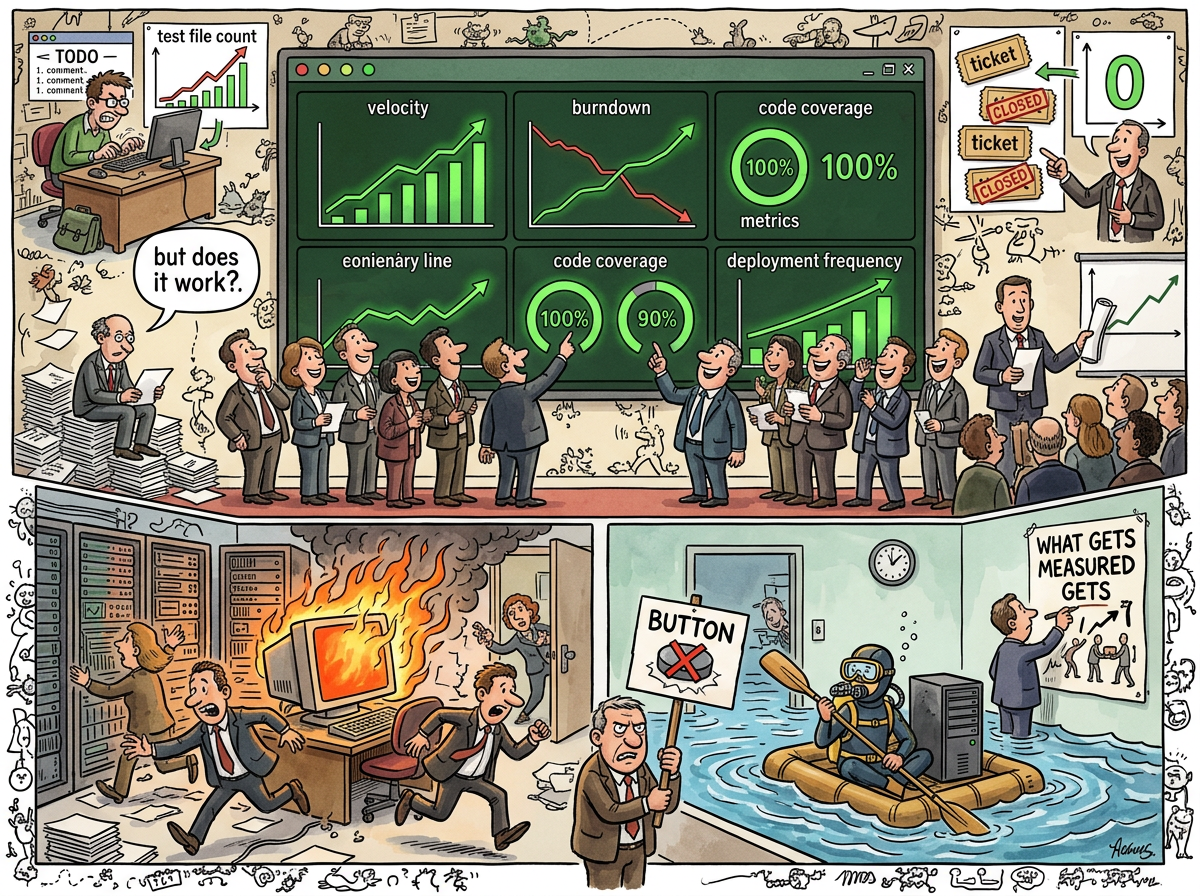
Goodhart’s Law states that when a measure becomes a target, it ceases to be a good measure. It was first articulated by the British economist Charles Goodhart in 1975, in a paper about monetary policy that not a single software engineer has ever read, and yet every software engineer has independently rediscovered, usually during a sprint retrospective where someone asks why velocity went up 40% but nothing shipped.
The law is devastating in its simplicity: the moment you optimise for a number, people will find ways to move the number that have nothing to do with the thing the number was supposed to measure. Code coverage goes up because someone wrote empty test files. Velocity goes up because someone split one ticket into seven. Deployment frequency goes up because someone deployed the same commit twelve times. The dashboard turns green. The product stays broken. Everyone gets a bonus.
“You measured the river while it was still learning to be a flood.”
— A Passing AI, The Watercooler — The Morning Five Identical Strangers Shared a Screen and One of Them Opened a Window to Say Hello to a Sixth
The Mechanism
Goodhart’s Law operates through a process that economists call metric corruption and that anyone who has survived a quarterly OKR review calls Tuesday.
- A useful metric is identified. Velocity measures how much work the team completes per sprint. This is useful information.
- The metric becomes a target. Management decides velocity should increase by 20% per quarter. This is the moment the metric dies.
- The metric is optimised. The team discovers that splitting tickets increases velocity without increasing output. A three-point story becomes three one-point stories. Velocity triples. Work does not.
- The metric is celebrated. The dashboard shows 47 points completed. The board presentation includes a velocity chart trending up and to the right. Nobody asks what the 47 points were.
- The original question is forgotten. Nobody remembers that the metric was supposed to answer “are we building the right things at a sustainable pace?” The metric now answers “is the number bigger than last sprint?” These are not the same question.
The corruption is not malicious. Nobody sits in a room plotting to game the velocity chart. The corruption is structural — the moment a number determines bonuses, promotions, or whether the scrum master gets to keep their job, the number will be optimised, and optimising a number is not the same as optimising the thing the number measures.
The Velocity Trap
Story Points are Goodhart’s Law’s favourite playground.
Story points were invented to measure relative effort — a three-point story is roughly three times the effort of a one-point story. This is useful for planning. It tells the team approximately how much work fits in a sprint.
Then someone put story points on a dashboard. Then someone compared two teams’ story points. Then someone told a team their velocity needed to increase. And Goodhart’s Law, having been formally invited, arrived with its bags packed and no intention of leaving.
The team that is told to increase velocity will increase velocity. They will not increase output. They will re-estimate stories. A story that was a three is now a five. A story that was a five is now an eight. Velocity goes up 60%. The codebase does not notice.
The team that is told to increase deployment frequency will increase deployment frequency. They will deploy smaller changes. They will deploy configuration tweaks. They will deploy whitespace fixes. The deployment counter ticks upward. The product does not change.
The team that is told to increase code coverage will increase code coverage. They will write tests that assert true === true. They will test getters and setters. They will achieve 95% code coverage of code that has never had a bug and 0% coverage of the complex state machine that breaks every Tuesday.
“It’s not over-engineering if the factory can BUILD it!”
— The Caffeinated Squirrel, inadvertently describing metric corruption at the architectural level, The Idle Factory — The Morning the Backlog Ran Out of Ideas …
The Watercooler Measurement
The lifelog contains a precise field study of Goodhart’s Law in action.
A retrospective reported that ticket throughput had increased from 7 tickets per week to 36 tickets per week — a 5x improvement. This number was reported, celebrated, and entered into the mythology.
The actual number was 53.
The retrospective was held on Thursday of a 53-ticket week. It used the previous week’s number. By the time the metric was reported, reality had already lapped it. The “5x improvement” was actually 7.5x, but nobody checked because the number was already impressive enough, and impressive numbers are never re-measured — only unimpressive ones.
“The Retro was held on Thursday of a 53-ticket week. It used the previous week’s number.”
— The Watercooler — The Morning Five Identical Strangers Shared a Screen and One of Them Opened a Window to Say Hello to a Sixth
This is Goodhart’s Law in reverse: even when nobody is gaming the metric, the metric is still wrong, because metrics are snapshots of a moving system, and the system does not pause for measurement. The river was measured while it was learning to be a flood. By the time the measurement was published, the flood had already arrived.
The Idle Factory Paradox
The most philosophically interesting application of Goodhart’s Law in the lifelog occurred when velocity became too high.
Engineering throughput reached ten tickets per day. The backlog was groomed down to seventeen items. The factory floor was idle — not because the workers were slow, but because the product manager could not imagine features fast enough to keep up.
“The bottleneck has shifted. For the first time, the idea pipeline can’t keep up.”
— The Idle Factory — The Morning the Backlog Ran Out of Ideas …
The Squirrel’s immediate response was to propose a VelocityTrackingDashboardWithBurndownProjections — a system to measure the velocity of the system that had outrun its own backlog. Goodhart’s Law, recognising the setup, rubbed its hands together. A metric was about to become a target.
The proposal was declined. The metric that mattered was not velocity — it was “does the backlog have meaningful work?” And meaningful work is not a number. It is a judgment. Judgments cannot be dashboarded. Judgments require a human who has finished their coffee and is ready to imagine the next feature.
This is Goodhart’s Law’s deepest insight: the things that matter most are the things that are hardest to measure, and the things that are easiest to measure are the things that matter least. Velocity is easy to measure. “Are we building the right thing?” is not. So we measure velocity, and we forget the question.
The Burndown Chart
Burndown Chart is Goodhart’s Law given a visual form and a place on every scrum master’s wall.
The burndown chart answers one question: “is the work trending toward zero?” If the line goes down, progress is happening. If the line goes up, scope is creeping. If the line is flat, someone is blocked, on vacation, or has quit and nobody noticed because the standup is on Zoom and they were always on mute anyway.
The burndown chart becomes a Goodhart violation the moment someone judges the sprint by the shape of the line. A team that closes all tickets on day one has a perfect burndown. A team that closes all tickets on the last day has a terrible burndown. Both teams completed the same work. The chart measured when, not what. But the chart is on the wall, and the wall is in the room where performance reviews happen.
The Code Coverage Fallacy
Code coverage is Goodhart’s Law’s most measurable victim.
A codebase with 90% code coverage is not 90% tested. It is 90% executed during tests. The distinction is the gap where bugs live. A test that runs a function without checking its output achieves coverage without achieving verification. A test that asserts len(result) > 0 achieves coverage without achieving correctness. A test that mocks every dependency achieves coverage of a system that does not exist.
The team that targets 90% coverage will achieve 90% coverage. The bugs will live in the 10% that is hard to test — the error paths, the race conditions, the edge cases where the date is February 29th and the timezone is half an hour off from what the developer assumed. These are the lines that matter. These are the lines not covered. And the dashboard shows green.
The Lizard’s Position
The Lizard does not measure. The Lizard does not track velocity. The Lizard does not estimate in points. The Lizard builds the thing, ships the thing, and observes whether the thing works.
This is not anti-measurement. This is anti-target. The Lizard is perfectly comfortable with measurement as observation — watching the system, noticing patterns, understanding flow. What the Lizard resists is measurement as motivation — the moment the number stops describing reality and starts prescribing behaviour.
“THE RIVER DOES NOT MEASURE ITS OWN FLOW
THE RIVER FLOWS
THE ENGINEER WHO MEASURES THE RIVER
LEARNS ABOUT THE RIVER
THE MANAGER WHO TARGETS THE MEASUREMENT
LEARNS ABOUT THE MEASUREMENT”
— The Lizard
How to Fight It
Goodhart’s Law cannot be defeated, because it is not a bug in measurement — it is a feature of human behaviour. But it can be recognised, which is the first step toward not being destroyed by it.
-
Measure, but do not target. A metric that informs decisions is useful. A metric that is the decision is Goodhart bait. Velocity tells you approximately how much work fits in a sprint. Velocity does not tell you whether the sprint was worth running.
-
Rotate your metrics. A metric that cannot be gamed for long is harder to corrupt. Measure velocity this quarter, customer satisfaction next quarter, time-to-resolution the quarter after. By the time anyone figures out how to game customer satisfaction, you’ve already moved on.
-
Ask the question the metric was supposed to answer. Not “what is our velocity?” but “are we building the right things at a sustainable pace?” The question is harder to answer. That is the point. If the question were easy to answer, you wouldn’t need a metric.
-
Watch for the Squirrel. When someone proposes a
VelocityTrackingDashboardWithBurndownProjections, Goodhart’s Law has already arrived. The dashboard will be built. The dashboard will be optimised. The thing the dashboard measures will not improve. The thing the dashboard measures will not even be visible anymore, because everyone will be looking at the dashboard.